Methods Development
calcFD Toolbox
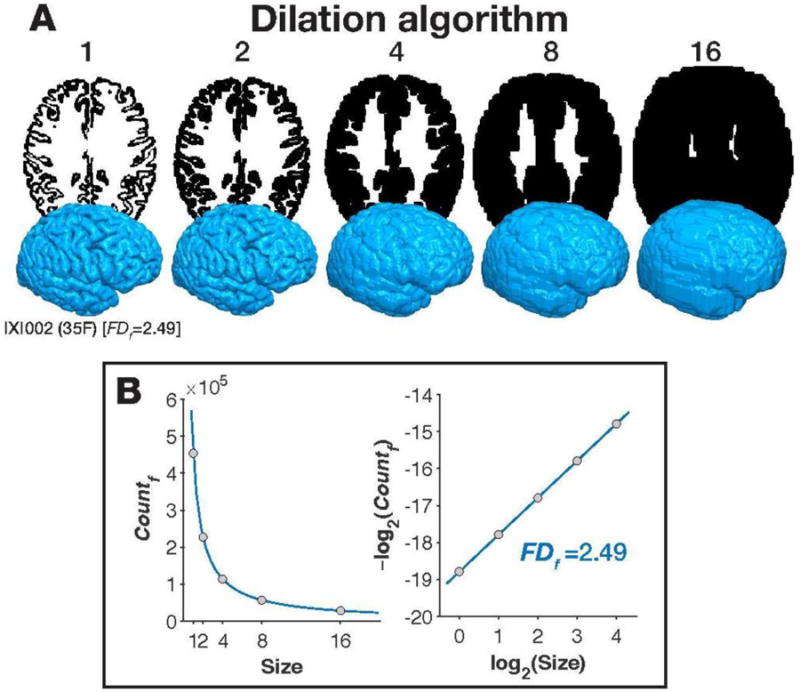
calcFD is a MATLAB toolbox for calculating the fractal dimensionality of a 3D structure, designed to work with intermediate files from the FreeSurfer analysis pipeline, but can also use other volumes. I have shown that applying this measure to cortical and subcortical structures relates to age-related differences better than extant measures such as cortical thickness, gyrification, and subcortical volume.
For a copy of the toolbox, go to https://github.com/cMadan/calcFD.
Related Publications
Madan, C. R., & Kensinger, E. A. (2016). Cortical complexity as a measure of age-related brain atrophy. NeuroImage, 134, 617-629. doi:10.1016/j.neuroimage.2016.04.029
Madan, C. R., & Kensinger, E. A. (2017). Age-related differences in the structural complexity of subcortical and ventricular structures. Neurobiology of Aging, 50, 87-95. doi:10.1016/j.neurobiolaging.2016.10.023
Madan, C. R., & Kensinger, E. A. (2017). Test-retest reliability of brain morphology estimates. Brain Informatics, 4(2), 107-121. doi:10.1007/s40708-016-0060-4
Madan, C. R. (2019). Shape-related characteristics of age-related differences in subcortical structures. Aging & Mental Health, 23(7), 800-810. doi:10.1080/13607863.2017.1421613
Collantoni, E., Madan, C. R., Meneguzzo, P., Chiappini, I., Tenconi, E., Manara, R., & Favaro, A. (2020). Cortical complexity in anorexia nervosa: A fractal dimension analysis. Journal of Clinical Medicine, 9(3), 833. doi:10.3390/jcm9030833
Madan, C. R. (2021). Age-related decrements in cortical gyrification: Evidence from an accelerated longitudinal dataset. European Journal of Neuroscience, 53(5), 1661-1671. doi:10.1111/ejn.15039
McDonough, I. M., & Madan, C. R. (2021). Structural complexity is negatively associated with brain activity: A novel multimodal test of compensation theories of aging. Neurobiology of Aging, 98, 185-196. doi:10.1016/j.neurobiolaging.2020.10.023
McIntyre-Wood, C., Madan, C. R., Owens, M., Sweet, L. & MacKillop, J. (2022). Neuroanatomical foundations of delayed reward discounting decision making II: Evaluation of sulcal morphology and fractal dimensionality. NeuroImage, 257, 119309. doi:10.1016/j.neuroimage.2022.119309
Wang, Y., Leiberg, K., Kindred, N., Madan, C. R, Poirer, C., Petkov, C. I., Taylor, P. N., & Mota, B. C. C. (2024). Neuro-evolutionary evidence for a universal fractal primate brain shape. eLife, 12, 92080. doi:10.7554/eLife.92080
calcSulc Toolbox
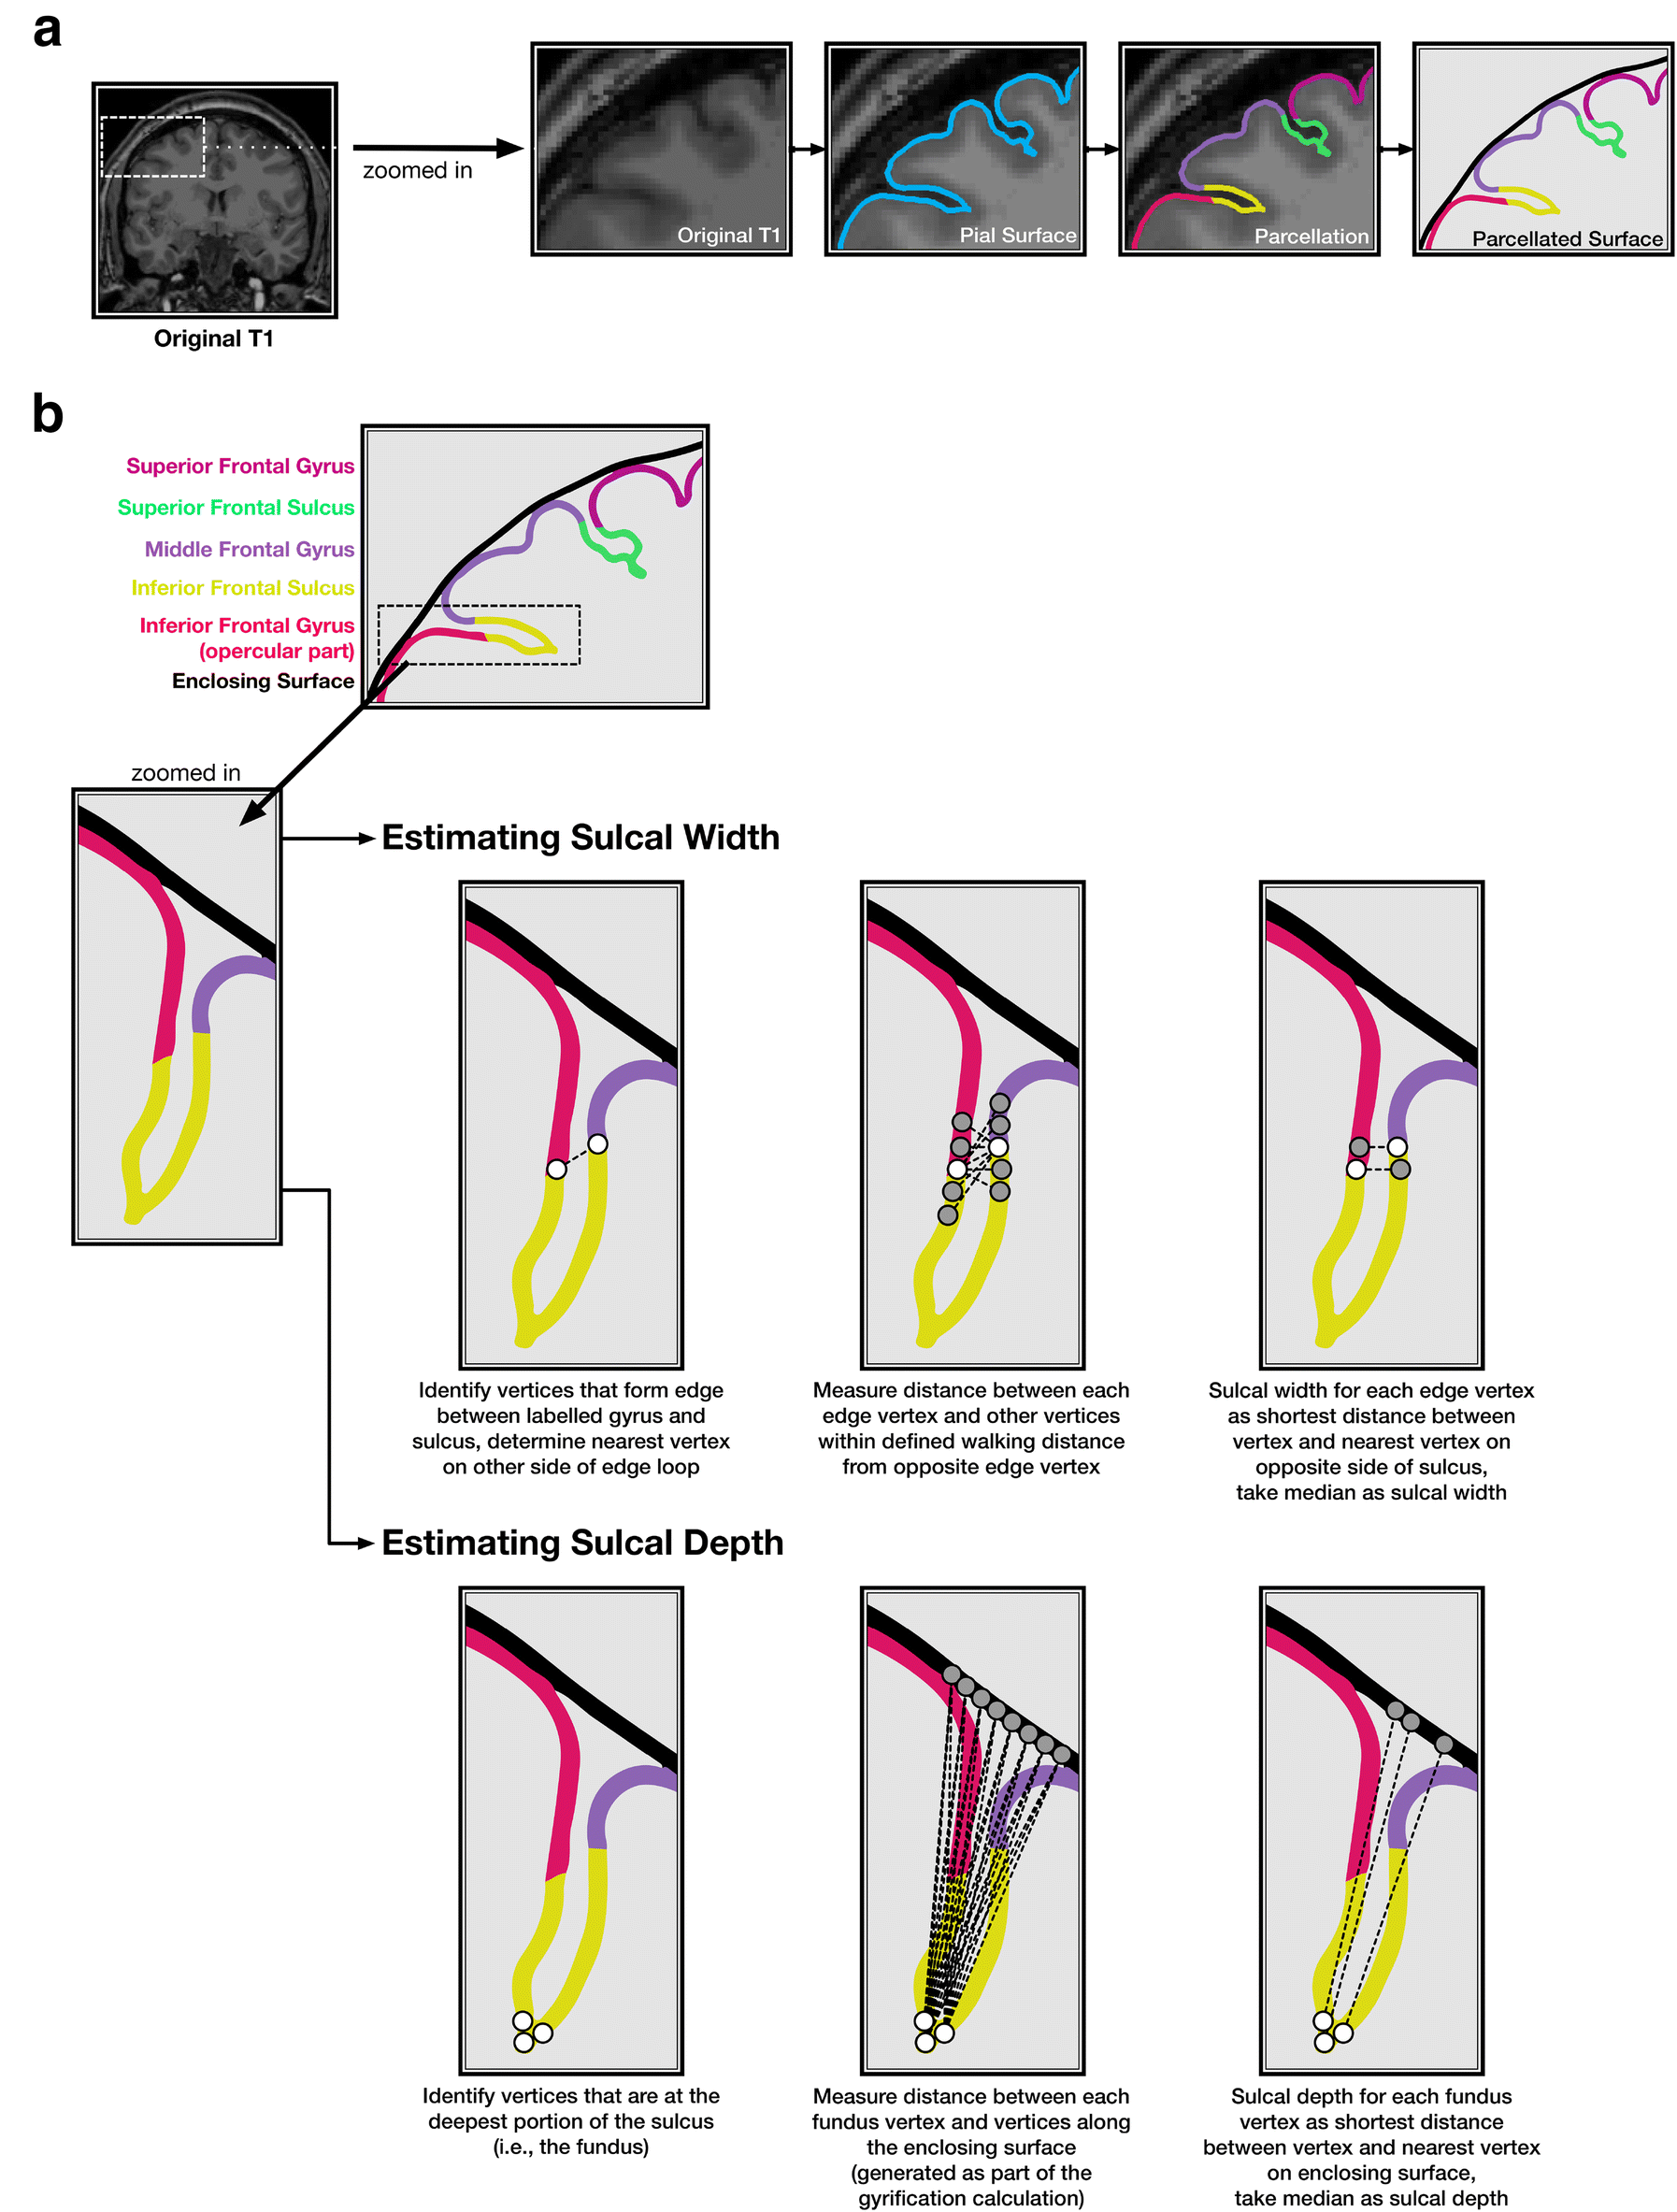
calcSulc is a MATLAB toolbox for calculating sulcal morphology (width and depth) from FreeSurfer surface files. These measures exhibit age-related differences and can provide more insight into structural changes than the more conventional gyrification index measure.
For a copy of the toolbox, go to https://github.com/cMadan/calcSulc.
Related Publications
Madan, C. R. (2019). Robust estimation of sulcal morphology. Brain Informatics, 6(1), 5. doi:10.1186/s40708-019-0098-1
Madan, C. R. (2021). Age-related decrements in cortical gyrification: Evidence from an accelerated longitudinal dataset. European Journal of Neuroscience, 53(5), 1661-1671. doi:10.1111/ejn.15039
McIntyre-Wood, C., Madan, C. R., Owens, M., Sweet, L. & MacKillop, J. (2022). Neuroanatomical foundations of delayed reward discounting decision making II: Evaluation of sulcal morphology and fractal dimensionality. NeuroImage, 257, 119309. doi:10.1016/j.neuroimage.2022.119309
Collantoni, E.*, Madan, C. R.*, Meregalli, V., Meneguzzo, P., Marzola, E., Panero, M., D'Agata, F., Abbate-Daga, G., Tenconi, E., Manara, R., & Favaro, A. (2021). Sulcal characteristics patterns and gyrification gradient at different stages of Anorexia Nervosa: a structural MRI evaluation. Psychiatry Research: Neuroimaging, 316, 111350. doi:10.1016/j.pscychresns.2021.111350
Test of Ability in Movement Imagery (TAMI)
TAMI is an objective test of ability in movement imagery. TAMI consists of 10 questions (preceded by one practice question) in which participants are asked to imagine a series of motor movements. Participants are then presented with several images and are asked to select the image that corresponds to their final body positioning. This booklet consists of the TAMI questionnaire and response sheet, along with pertinent details regarding the administration and scoring of TAMI.
For a copy of the TAMI administration manual, please email me (christopher.madan@nottingham.ac.uk).
Related Publications
Madan, C. R., & Singhal, A. (2013). Introducing TAMI: An objective test of ability in movement imagery. Journal of Motor Behavior, 45(2), 153-166. doi:10.1080/00222895.2013.763764
Madan, C. R., & Singhal, A. (2014). Improving the TAMI for use with athletes. Journal of Sports Sciences, 32(14), 1351-1356. doi:10.1080/02640414.2014.889847
Madan, C. R., & Singhal, A. (2015). No sex differences in the TAMI. Cognitive Processing, 16(2), 203-209. doi:10.1007/s10339-014-0644-y
Madan, C. R., Ng, A., & Singhal, A. (2018). Prototypical actions with objects are more easily imagined than atypical actions. Journal of Cognitive Psychology, 30(3), 314-320. doi:10.1080/20445911.2018.1429448
Chen, Y. Y.*, Lambert, K.*, Madan, C. R., & Singhal, A. (2021). Mu oscillations and motor imagery performance: A reflection of intra-individual success, not inter-individual ability. Human Movement Science, 78, 102819. doi:10.1016/j.humov.2021.102819
Meregalli, V., Tenconi, E., Madan, C. R., Soma, E., Meneguzzo, P., Ceccato, E., Zuanon, S., Sala, A., Favaro, A., & Collantoni, E. (2023). Beyond body image: what body schema and motor imagery can tell us about the way patients with Anorexia Nervosa experience their body. Psychiatry and Clinical Neurosciences, 77(2), 94-101. doi:10.1111/pcn.13501
3D Brain MRI guides
While magnetic resonance imaging (MRI) data is itself 3D, it is often difficult to adequately present the results papers and slides in 3D. As a result, findings of MRI studies are often presented in 2D instead. A solution is to create figures that include perspective and can convey 3D information; such figures can sometimes be produced by standard functional magnetic resonance imaging (fMRI) analysis packages and related specialty programs. However, many options cannot provide functionality such as visualizing activation clusters that are both cortical and subcortical (i.e., a 3D glass brain), the production of several statistical maps with an identical perspective in the 3D rendering, or animated renderings.
Here I developed one guide for the generation of 3D brain renderings, and another guide that outlines the steps for generating a print-ready 3D model of brain structures from a standard structural MRI volume.
Related Publications
Pernet, C. R.*, & Madan, C. R.* (2020). Data visualization for inference in tomographic brain imaging. European Journal of Neuroscience, 51(3), 695-705. doi:10.1111/ejn.14430
Breathe Easy EDA (BEEDA)
Electrodermal activity (EDA) methods evaluate fluctuations in skin electrical conductance, providing a measure of sympathetic nervous system arousal. Respiration influences EDA, such that irregular breathing causes EDA fluctuations which cannot be unambiguously distinguished from changes related to psychophysiological arousal. Thus, it is crucial to control for respiration-induced EDA artifacts. Here we developed a MATLAB toolbox for eliminating EDA respiration artifacts and analyzing EDA data, which we freely distribute: Breathe Easy EDA or ‘BEEDA’. BEEDA’s artifact removal GUI allows users to quickly clean EDA data, greatly facilitating EDA analysis. Additionally, BEEDA’s analysis functions allow users to seamlessly analyze the cleaned data. The EDA analysis capabilities include tonic and phasic EDA measurements, following from standard methodological implementations. The toolbox is suitable for any experiment recording both EDA and respiration data, and flexibly adjusts to experiment-specific parameters (e.g., trial structure and desired analysis parameters).
Related Publications
Ksander, J. C., Kark, S. M., & Madan, C. R. (2018). Breathe Easy EDA: A MATLAB toolbox for psychophysiology data management, cleaning, and analysis. F1000Research, 7, 216. doi:10.12688/f1000research.13849.2
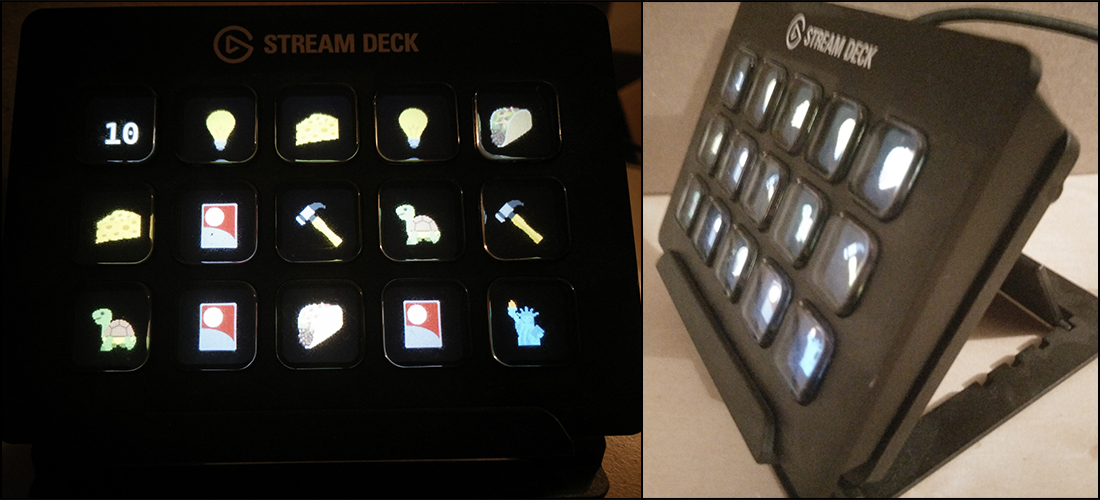
ElGateau
In experimental psychology research, we often ask participants to press specific keys to correspond to responses in the experiment. For instance, one key for 'old' and another for 'new' in an old/new recognition memory test, 'word' and 'nonword' in a lexical decision task, or red/green/blue in a Stroop test. Sometimes we put stickers over keys on a keyboard to remind participants of these key mappings, but often they are merely included as part of the experiment instructions. What if we could easily just write 'old' and 'new' on the keys themselves? This approach could additionally lead to more manageable (and automatically logged) counterbalancing across participants, but we could further readily counterbalance key mappings across trials (or blocks of trials) if desired. In some cases, a whole experiment could be implemented on an LCD keypad. This project is the infrastructure for implementing experiments with an LCD keypad called the Elgato Stream Deck.
For a copy of the toolbox, go to https://github.com/cMadan/ElGateau.
Related Publications
Spectral time-lapse (STL) Toolbox
The spectral time-lapse (STL) algorithm is designed to be a simple and efficient technique for analyzing and presenting both spatial and temporal information of animal movements within a two-dimensional image representation. The STL algorithm re-codes an animal's position at every time point with a time-specific color, and overlaid it over a reference frame of the video, to produce a summary image. It additionally incorporates automated motion tracking, such that the animal's position can be extracted and summary statistics such as path length and duration can be calculated, as well as instantaneous velocity and acceleration. This toolbox implements the STL algorithm as a MATLAB toolbox and allows for a large degree of end-user control and flexibility.
For a copy of the toolbox, go to https://github.com/cMadan/stl-toolbox.
Related Publications
Madan, C. R., & Spetch, M. L. (2014). Visualizing and quantifying movement from pre-recorded videos: The spectral time-lapse (STL) algorithm. F1000Research, 3, 19. doi:10.12688/f1000research.3-19.v1
Baron, D. M., Ramirez, A. J., Bulitko, V., Madan, C. R., Greiner, A., Hurd, P. L., & Spetch, M. L. (2015). Practice makes proficient: Pigeons (Columba livia) learn efficient routes on full-circuit navigational traveling salesperson problems. Animal Cognition, 18(1), 53-64. doi:10.1007/s10071-014-0776-6